Many Aspects to consider by Optimizing Inventory
Some days ago I wrote about Whom should Mobile Social Networks partner with in Mobile Advertising and today I would like to share some experience from the perspective of a publisher with three mobile advertisement optimizer; smaato.com, admarvel.com and nexage.com (now yahoo advertising). Beside smooth technical integration the evaluation of relevant operating figures like e.g. revenue, eCPM or fill rate is for me important. For my daily work I wish – in the best case – to get the figures real time. Maybe I am spoiled by the extensive admob back office and I understand that the optimizer need to collect and reprocess the figures from all their partners, but it still see some improvement of their back offices, so I can better get through with my personal every-day tasks. For example I am missing a more detailed effective cost per mille (eCPM) analysis. In one back office I get the eCPM for the top 10 countries, in the second one I find the eCPM for each advertisement network and the third one doesn’t provide any eCPM calculation. And sometimes there is also some fine tuning to be done, like putting all the figures for the same country together and not to separate them into e.g. Congo, The Democratic Republic of the Congo and Zaire 🙂
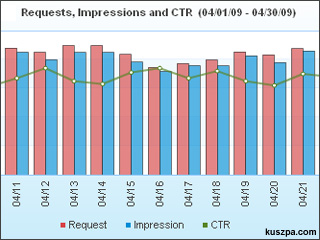
Not every optimizer has a daily (one has a weekly) and a country specific (one has only the top10 countries) breakdown of the figures, so a detailed analysis e.g. of the daily click through rate (CTR) in a certain country is not possible. And I must say that there are also big differences in the speed when jumping from one statistic to another between the three different back offices. Sometimes I am also not sure if the figures are completed, because some data are included bit by bit after some days and the optimizers don’t get all information from all their networks. This doesn’t come as a big surprise, because in the best case they have connected you as publisher to 20+ different advertisement sources. But this all makes it more difficult for a publisher to compare the three services in terms of economic performance, but also to compare them to other alternatives, like a direct integration of an advertisement network.
Increase the fill rate of ads
Another good thing for a publisher using an optimizer is the allocations of ad sources to increase the overall fill rate. The experience shows that there are big differences in the three testes systems; for one particular country we had a range from 33,6% over 89,1% to 99,0% fill rate. I know that it’s only one of several performance indicators, but still the test shows, that you should consider various aspects in your decision making. For my personal conclusion I must say, that the cooperation with all of those advertisement optimizers is a valuable experience for me and for a better understanding of our business, but there is still much home work to be done for those new players in the mobile industry. In the last months I heard many different thoughts about the future of the mobile advertisement optimizers and I am really curious about future development.
so did you see a CPM uplift as a result of using them?
James, unfortunately we still don’t really know, because of the lack of some data, but we have an idea how to find this out… I hope I can tell you more on that in a few days. I am very curious on this too.
Maciej, I am sure everyone will find your analysis work very helpful. You have taken the right approach and focusing on the right issues. As you have realized, the mobile ad industry, still has a long way to go to standardize the back office. In the meantime, we at Nexage are working hard to provide a single dashboard for publishers to monitor and control all your mobile ad networks. Thanks for evaluating us and on continuing to use Nexage’s AdMax solution.